After deployment, SIMB3 captures data on predefined intervals which flows back to our system where it is processed and put online instantly via the SIMB3 Deployment Webpage.
For public SIMB3 deployments, anyone with an internet connection can view and download data from the deployment webpage. For private deployments, only the instrument owner and designated collaborators can view the webpage or download data.
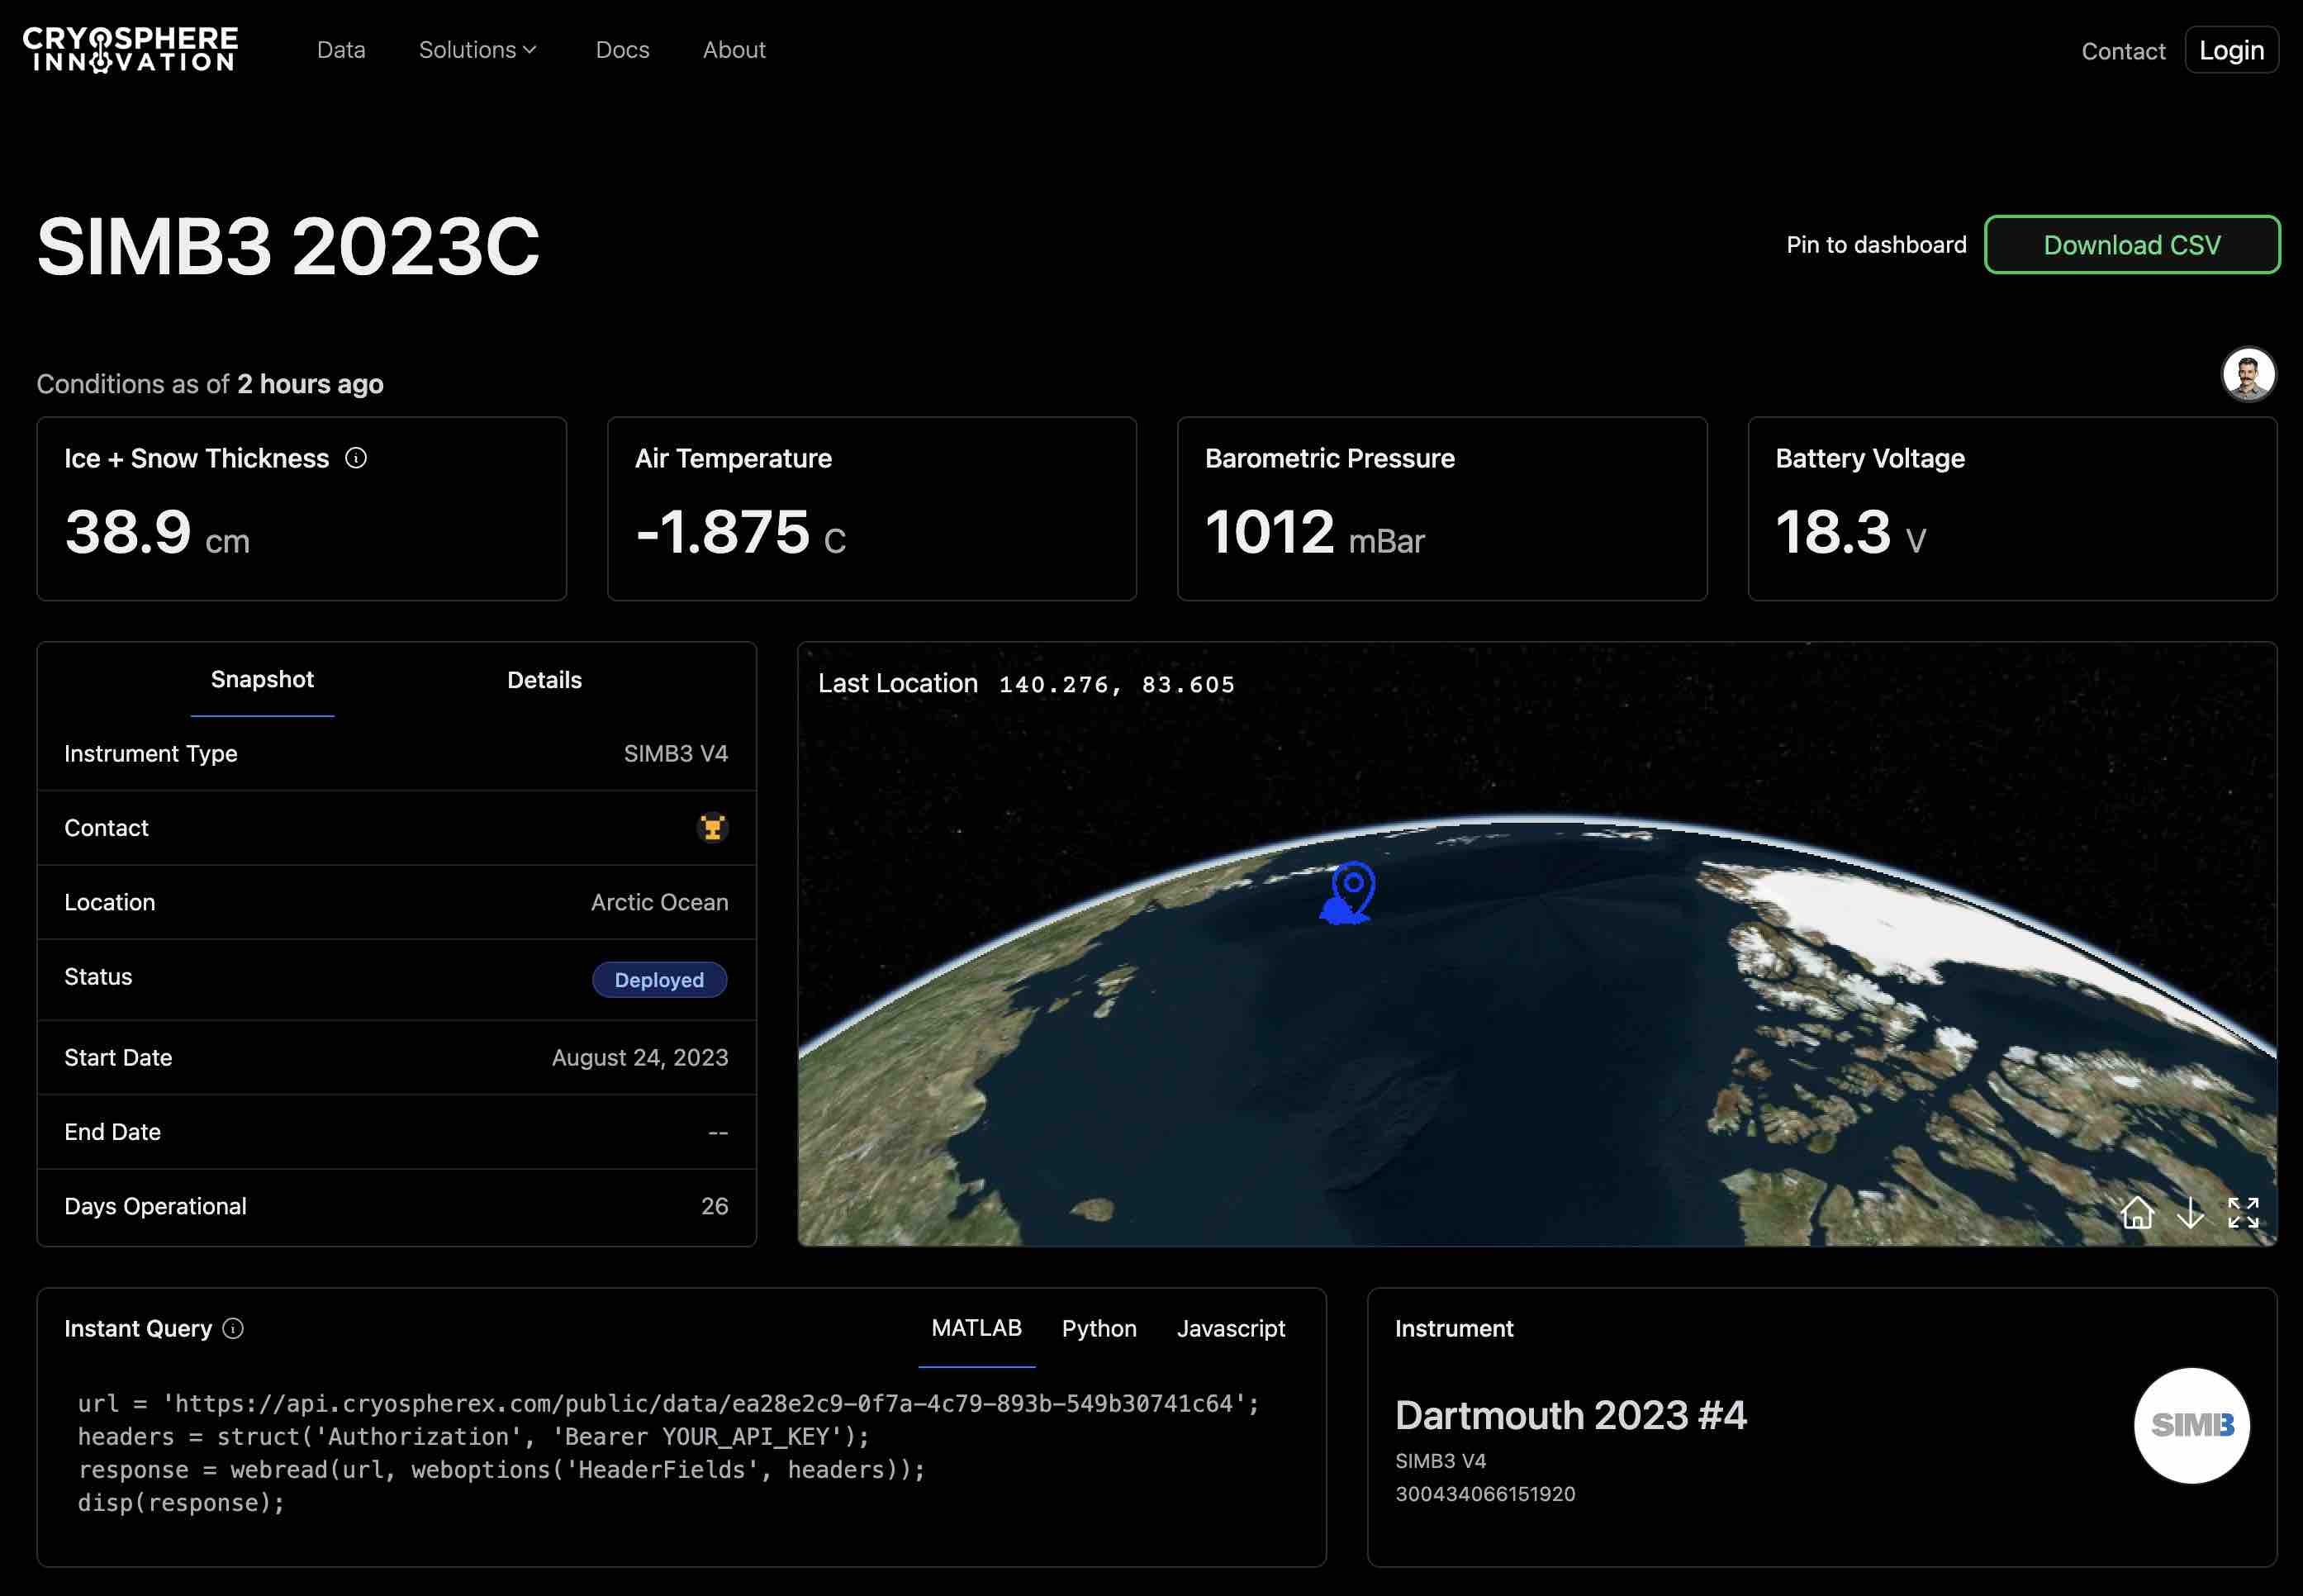 An example SIMB3 webpage.
Webpage Features & Highlights
Viewing current conditions
When the deployment is active, data is updated in real-time, with snapshots of the current conditions listed on the top tiles. The real-time tiles are selectable by the deployment/instrument owner, but default to Ice + Snow Thickness, Air Temperature, Barometric Pressure, and Battery Voltage.
Deployment status & metadata
Below the real-time tiles is the deployment metadata tile. The metadata tile contains information about the deployment, such as the deployment location and the current status. Deployments can have three different status levels.
- Deployed. The deployment is ongoing with the instrument actively transmitting.
- Inactive. The deployment has ended. Formerly "retired".
- Undeployed. This deployment is pending but not yet active.
The metadata tile also includes information such as the deployment start date and end date. Under the "details" tab you will find auxiliary information such as deployment ice and snow thickness and any notes.
Drift track and current location
The drift track as well as the starting/ending position of the deployment are plotted on the interactive 3D globe. The start position is indicated by the filled dot and the current/last known location is indicated by the pin icon.
You can change the orientation of the globe by clicking and dragging it. You can also make it full screen by hitting the "expand" icon in the bottom left corner.
Accessing data
There are two main ways to access deployment data and metadata.
Download as CSV
The easiest way to access data from any Cryosphere Innovation deployment (not just SIMB3) is by clicking the green "Download CSV" button at the top of the page. This will download a fresh and fully up-to-date copy of the deployment data.
Via REST API
You can also access deployment data programmatically using our REST API. The Instant Query tile gives code snippets to get you started, but requests can also be refined to retrieve only specific fields, as in this example. Metadata can be programmatically fetched in a similar fashion.
Instrument Card
The details of the deployed instrument can be found in the instrument detail card. For SIMB3, this card give the SIMB3 version as well as the IMEI.
The Ice Thickness (Mass Balance) Plot
The surface_distance and bottom_distance values from the SIMB3 data suite are combined to create a time-series of ice + snow thickness. If available, the plot is initialized with initial conditions taken at the time of deployment. If these values are not available, the plot is generated by subtracting the raw values of surface_distance and bottom_distance from the distance between SIMB3 sounders and assuming a flotation depth.
Sensor Time-series Plots
The final element on the SIMB3 webpage is the Sensor Time-Series tile, which gives you the ability to view the time-series from any of the sensors on a given instrument. Hovering over the plot will reveal the value at the current time-stamp, and additional charts can be added by selecting "Add Chart".